Market Outlook
June 6, 2017
Market Cues
Domestic Indices
Chg (%)
(Pts)
(Close)
Indian markets are likely to open on Positive note tracking the SGX Nifty.
BSE Sensex
0.1
36
31,309
U.S. markets closed lower Monday, slightly below record levels, as investors
Nifty
0.2
22
9,675
grappled with a variety of geopolitical issues, such as terrorist attacks in London
Mid Cap
0.2
23
14,824
ahead of the U.K. election and the scheduled public testimony of fired Federal
Small Cap
0.6
99
15,410
Bureau of Investigation Director James Comey.
Bankex
0.4
94
26,593
The European markets ended the first session of the new trading week with modest
losses. Investors were in a cautious mood following the latest terrorist attack in
Global Indices
Chg (%)
(Pts)
(Close)
London over the weekend. Some markets also remained closed for a holiday
Monday, including the DAX of Germany and the SMI of Switzerland.
Dow Jones
(0.1)
(22)
21,184
Nasdaq
(0.2)
(10)
6,296
Indian markets eked out modest gains to hit fresh record closing highs on Monday
FTSE
(0.3)
(22)
7,526
even as underlying sentiment remained cautious elsewhere Asia and Europe after a
Nikkei
(0.0)
(6)
20,171
U.S. jobs report failed to meet expectations and Islamic terrorism once again stuck
the United Kingdom, killing at least seven people and injuring 48 more.
Hang Seng
(0.2)
(61)
25,863
Shanghai Com
(0.4)
(14)
3,092
News Analysis
ITC to expand frontiers with foray into fruits, veggies
Advances / Declines
BSE
NSE
Detailed analysis on Pg2
Advances
1,451
934
Investor’s Ready Reckoner
Declines
1,270
748
Key Domestic & Global Indicators
Unchanged
161
104
Stock Watch: Latest investment recommendations on 150+ stocks
Refer Pg5 onwards
Volumes (` Cr)
Top Picks
BSE
3,013
CMP
Target
Upside
Company
Sector
Rating
NSE
20,992
(`)
(`)
(%)
Blue Star
Capital Goods
Buy
643
760
18.3
Dewan Housing Fin. Financials
Buy
431
520
20.7
#Net Inflows (` Cr)
Net
Mtd
Ytd
Mahindra Lifespace Real Estate
Buy
424
522
23.0
FII
(451)
(451)
51,518
Navkar Corporation Others
Buy
217
265
22.3
MFs
449
8,960
29,642
KEI Industries
Capital Goods
Accumulate
218
239
9.4
More Top Picks on Pg3
Top Gainers
Price (`)
Chg (%)
Key Upcoming Events
Titan
552
17.0
Previous
Consensus
Date
Region
Event Description
Tataelxsi
1,492
9.8
Reading
Expectations
Jun 07, 2017 India
RBI Reverse Repo rate
6.00
6.00
Pcjeweller
550
9.4
Jun 07, 2017 India
RBI Cash Reserve ratio
4.00
4.00
Raymond
752
6.9
Jun 07, 2017 India
RBI Repo rate
6.25
6.25
Unitdspr
2,482
5.9
Jun 08, 2017 US
Initial Jobless claims
248.00
240.00
Jun 08, 2017 Euro Zone ECB announces interest rates
-
-
Top Losers
Price (`)
Chg (%)
Jun 08, 2017 Euro Zone Euro-Zone GDP s.a. (QoQ)
0.50
0.50
More Events on Pg4
Videoind
35
(4.9)
Marksans
43
(4.4)
Sintex
24
(4.1)
Kpit
112
(4.0)
M&Mfin
373
(4.0)
#as on 5th June, 2017
Market Outlook
June 6, 2017
News Analysis
ITC to expand frontiers with foray into fruits, veggies
ITC would sell premium fruits and vegetables and pricey processed foods,
competing directly with existing retailers and new age grocers such as Amazon
Fresh, hastening its transformation into one of India’s most diversified consumer
companies from just the country’s biggest cigarette maker. At the core of ITC’s
initiatives to expand beyond snack foods is an elaborate distribution network,
underpinning a wider product portfolio at the century-old giant: Seeking to
strengthen its `10,000cr diversified consumer business, ITC plans to build a
retailing presence rivaling that of Mother Dairy.
ITC’s consumer business, which includes packaged food, personal care and
educational stationery products, crossed `10,000cr in revenues in 2016-17,
registering sales growth of 8% to `10,512cr. As per ITC, the company is now
among the fastest-growing branded packaged foods businesses in the country.
ITC will also sell online, starting with BigBasket and other existing online channels
by next quarter. The profitability of ITC’s consumer goods businesses declined 72
per cent last year to `28cr. The company attributed the contraction to higher input
prices, gestation costs of relatively newer categories such as juices and dairy, and
sales disruption because of demonetization
Economic and Political News
Two-wheeler industry to grow 8-10% in FY18; note ban pangs warning: Icra
Govt considers further relaxation in FDI norms for defence sector
PM Modi reviews GST ahead of July 1 rollout
Corporate News
Tata Motors' ED Ravindra Pisharody steps down; Satish Borwankar new COO
Applications for H-1B visas drop as TCS increases local hiring in US
Aban Offshore's receivables from Iran dip $36 mn after lifting of sanctions
Jet Airways in talks to buy 75 aircraft: Sources
Market Outlook
June 6, 2017
Top Picks HHHHH
Market Cap
CMP
Target
Upside
Company
Rationale
(` Cr)
(`)
(`)
(%)
Strong growth in domestic business due to its leadership
in acute therapeutic segment. Alkem expects to launch
Alkem Laboratories
23,358
1,954
2,161
10.6
more products in USA, which bodes for its international
business.
We expect the company would report strong profitability
Asian Granito
1,205
400
405
1.2
owing to better product mix, higher B2C sales and
amalgamation synergy..
Favourable outlook for the AC industry to augur well for
Cooling products business which is out pacing the market
Blue Star
6,143
643
760
18.3
growth. EMPPAC division's profitability to improve once
operating environment turns around..
With a focus on the low and medium income (LMI)
consumer segment, the company has increased its
Dewan Housing Finance
13,498
431
520
20.7
presence in tier-II & III cities where the growth opportunity
is immense.
Strong loan growth backed by diversified loan portfolio
and adequate CAR. ROE & ROA likely to remain decent
Equitas Holdings
5,411
160
235
46.8
as risk of dilution remains low. Attractive valuations
considering growth.
Economic recovery to have favourable impact on
advertising & circulation revenue growth. Further, the
Jagran Prakashan
5,960
182
225
23.4
acquisition of a radio business (Radio City) would also
boost the company's revenue growth.
High order book execution in EPC segment, rising B2C
KEI Industries
1,697
218
239
9.4
sales and higher exports to boost the revenues and
profitability
Speedier execution and speedier sales, strong revenue
Mahindra Lifespace
2,178
424
522
23.0
visibilty in short-to-long run, attractive valuations
Massive capacity expansion along with rail advantage at
Navkar Corporation
3,091
217
265
22.3
ICD as well CFS augurs well for the company
Market leadership in Hindi news genre and no.
2
viewership ranking in English news genre, exit from the
TV Today Network
1,598
268
344
28.4
radio business, and anticipated growth in ad spends by
corporates to benefit the stock.
Source: Company, Angel Research
Market Outlook
June 6, 2017
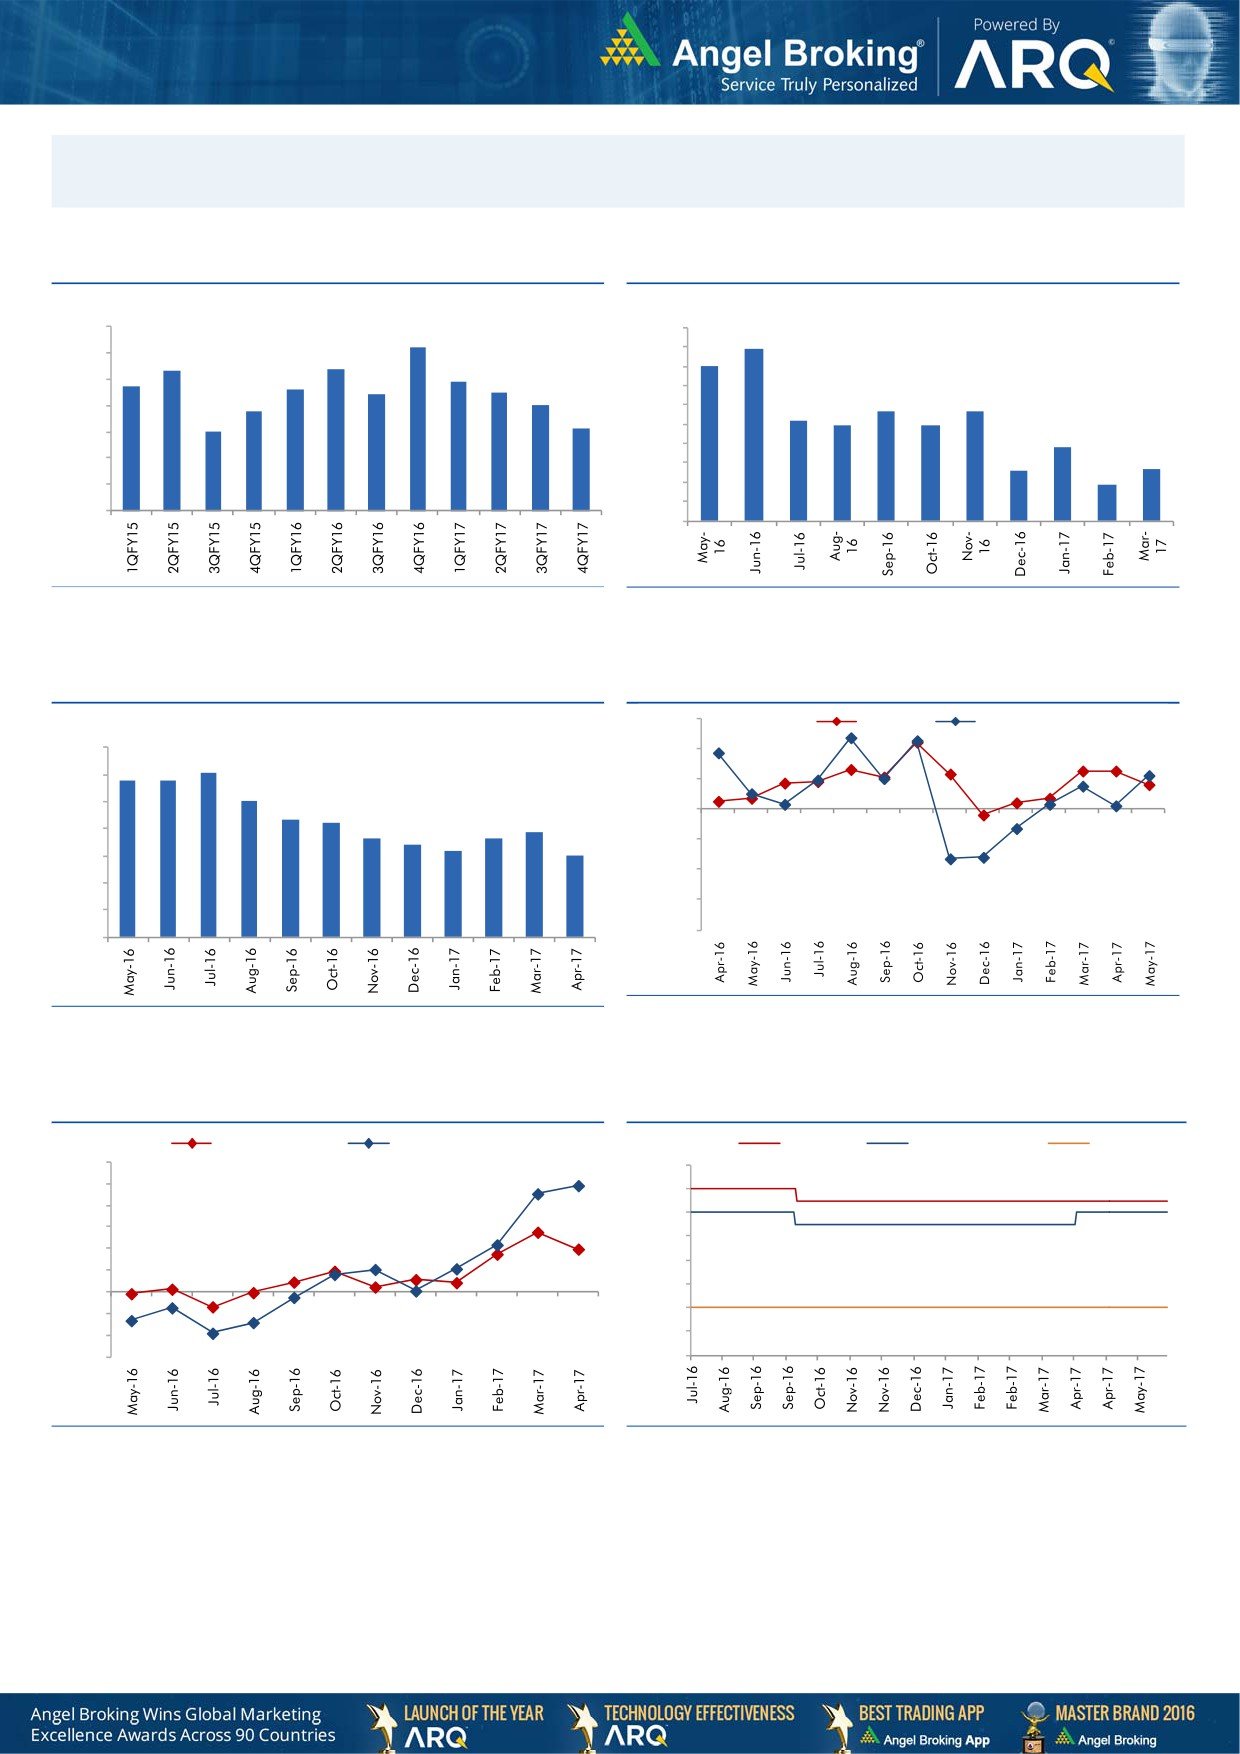
Macro watch
Exhibit 1: Quarterly GDP trends
Exhibit 2: IIP trends
(%)
(%)
10.0
9.2
10.0
8.9
9.0
8.3
8.4
9.0
8.0
7.7
7.9
8.0
7.6
7.5
8.0
7.4
7.0
7.0
6.8
5.7
5.7
7.0
6.0
5.2
4.9
4.9
6.0
6.1
6.0
5.0
3.8
4.0
2.6
2.7
5.0
3.0
1.9
4.0
2.0
1.0
3.0
-
Source: CSO, Angel Research
Source: MOSPI, Angel Research
Exhibit 3: Monthly CPI inflation trends
Exhibit 4: Manufacturing and services PMI
56.0
Mfg. PMI
Services PMI
(%)
7.0
54.0
6.1
5.8
5.8
6.0
52.0
5.1
5.0
4.3
4.2
50.0
3.9
3.6
3.7
4.0
3.4
3.2
3.0
48.0
3.0
46.0
2.0
44.0
1.0
42.0
-
Source: Market, Angel Research; Note: Level above 50 indicates expansion
Source: MOSPI, Angel Research
Exhibit 5: Exports and imports growth trends
Exhibit 6: Key policy rates
(%)
Exports yoy growth
Imports yoy growth
(%)
Repo rate
Reverse Repo rate
CRR
60.0
7.00
50.0
6.50
40.0
6.00
30.0
5.50
20.0
5.00
10.0
4.50
0.0
4.00
(10.0)
(20.0)
3.50
(30.0)
3.00
Source: Bloomberg, Angel Research
Source: RBI, Angel Research
Market Outlook
June 6, 2017
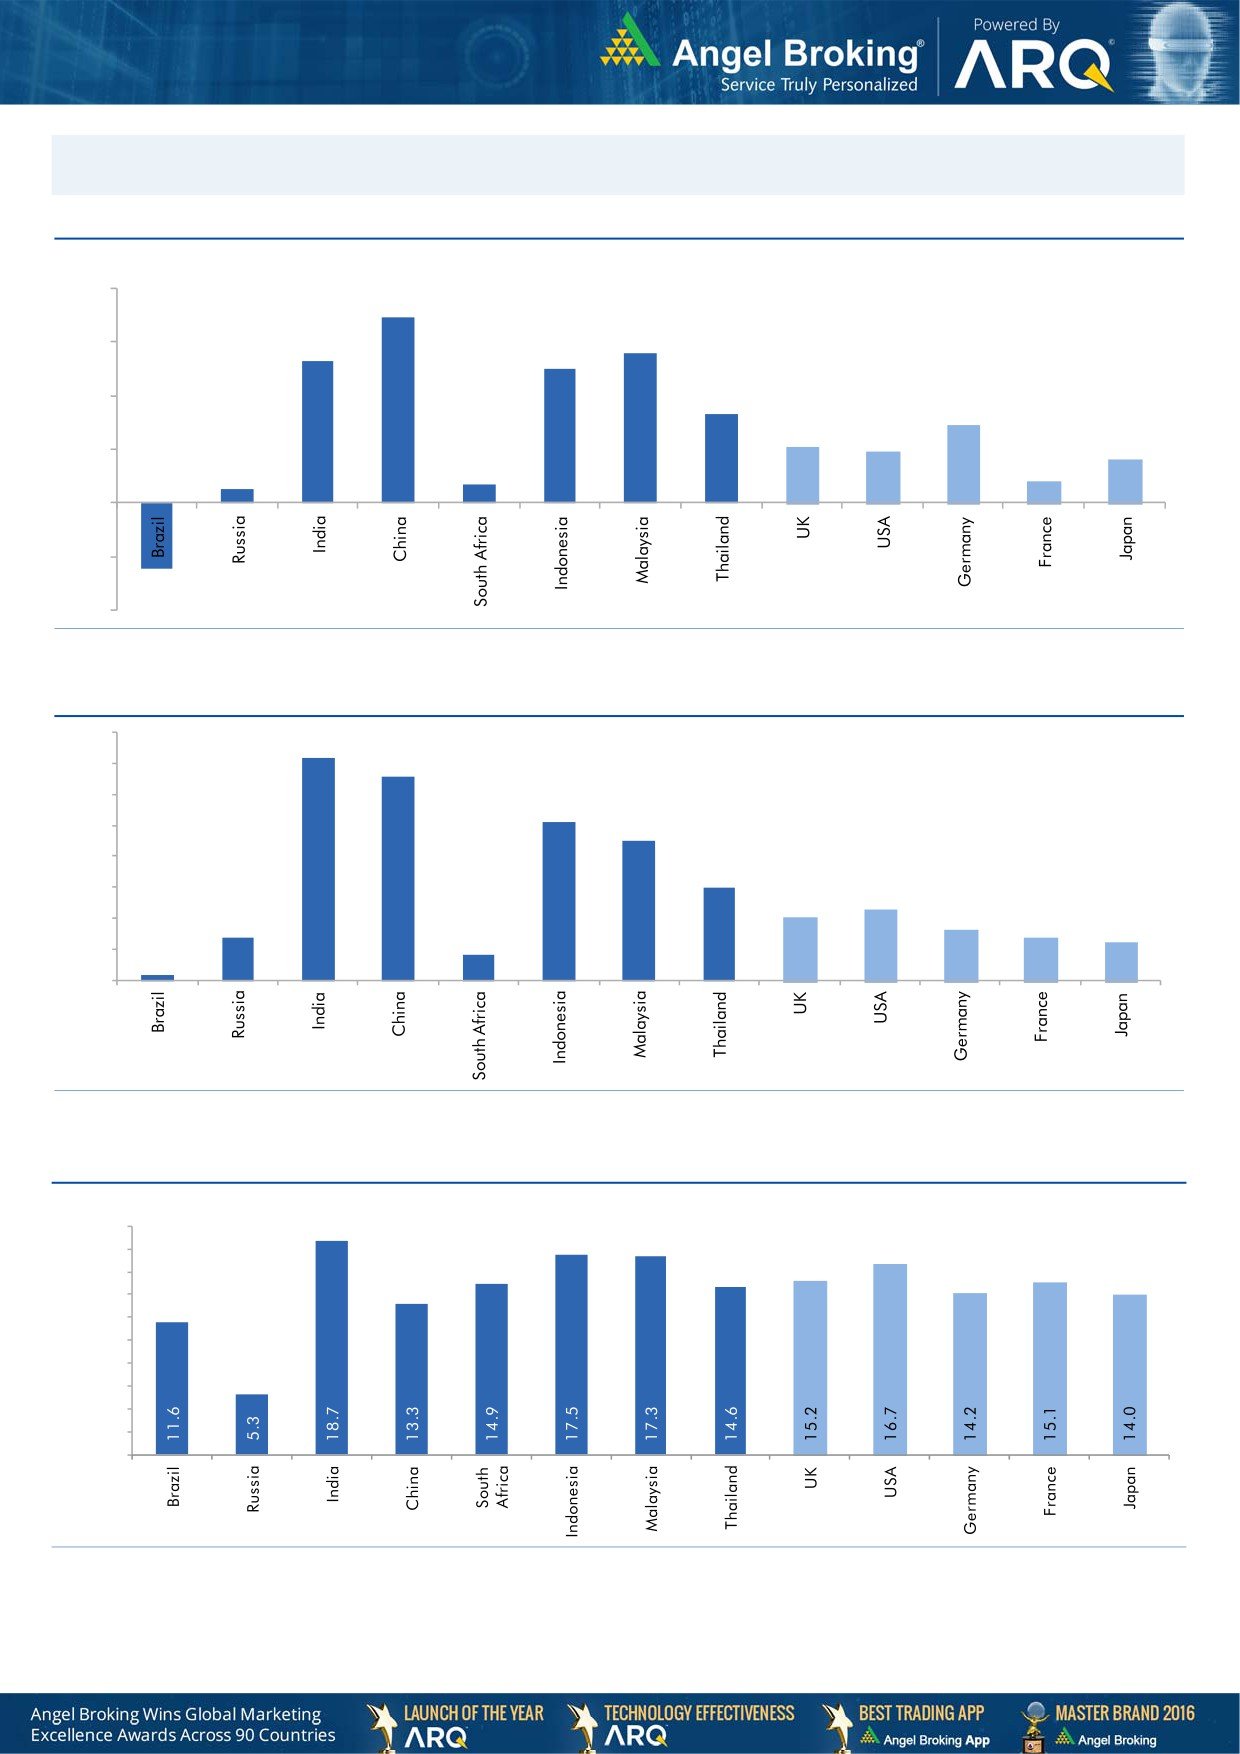
Global watch
Exhibit 1: Latest quarterly GDP Growth (%, yoy) across select developing and developed countries
(%)
8.0
6.9
5.6
6.0
5.3
5.0
0.7
4.0
3.3
2.9
2.1
1.9
0.5
2.0
1.6
0.8
-
(2.0)
(2.5)
(4.0)
Source: Bloomberg, Angel Research
Exhibit 2: 2016 GDP Growth projection by IMF (%, yoy) across select developing and developed countries
(%)
7.2
7.0
6.6
6.0
5.1
5.0
4.5
4.0
3.0
3.0
2.3
2.0
1.4
1.6
2.0
1.4
1.2
0.2
0.8
1.0
-
Source: IMF, Angel Research
Exhibit 3: One year forward P-E ratio across select developing and developed countries
(x)
20.0
18.0
16.0
14.0
12.0
10.0
8.0
6.0
4.0
2.0
-
Source: IMF, Angel Research
Market Outlook
June 06, 2017
Exhibit 4: Relative performance of indices across globe
Returns (%)
Country
Name of index
Closing price
1M
3M
1YR
Brazil
Bovespa
62,450
(3.7)
(5.2)
25.2
Russia
Micex
1,878
(7.4)
(8.8)
(3.8)
India
Nifty
9,675
3.4
8.2
18.6
China
Shanghai Composite
3,092
(1.7)
(5.0)
8.4
South Africa
Top 40
46,442
(0.7)
5.2
(2.2)
Mexico
Mexbol
49,592
1.2
4.5
8.1
Indonesia
LQ45
964
2.5
7.9
18.7
Malaysia
KLCI
1,788
0.9
4.7
9.2
Thailand
SET 50
988
(0.5)
1.0
9.4
USA
Dow Jones
21,184
1.1
0.8
18.2
UK
FTSE
7,526
4.0
1.9
19.8
Japan
Nikkei
20,171
4.5
4.0
19.8
Germany
DAX
12,823
2.4
6.3
27.1
France
CAC
5,308
(1.2)
6.9
25.6
Source: Bloomberg, Angel Research
Stock Watch
June 06, 2017
Company Name
Reco
CMP
Target
Mkt Cap
Sales ( Čcr )
OPM(%)
EPS (Č)
PER(x)
P/BV(x)
RoE(%)
EV/Sales(x)
(Č)
Price ( Č)
( Č cr )
FY17E
FY18E
FY17E
FY18E
FY17E
FY18E
FY17E
FY18E
FY17E
FY18E
FY17E
FY18E
FY17E
FY18E
Agri / Agri Chemical
Rallis
Neutral
252
-
4,892
1,937
2,164
13.3
14.3
9.0
11.0
28.0
22.9
4.9
4.3
18.4
19.8
2.6
2.3
United Phosphorus
Neutral
873
-
44,321
15,176
17,604
18.5
18.5
37.4
44.6
23.3
19.6
4.6
3.8
21.4
21.2
3.0
2.6
Auto & Auto Ancillary
Amara Raja Batteries
Buy
877
1,009
14,982
5,305
6,100
16.0
16.3
28.4
34.0
30.9
25.8
6.0
5.0
19.3
19.3
2.8
2.5
Apollo Tyres
Neutral
248
-
12,629
12,877
14,504
14.3
13.9
21.4
23.0
11.6
10.8
1.8
1.6
16.4
15.2
1.1
1.1
Ashok Leyland
Buy
93
111
26,467
20,021
21,915
11.6
11.9
4.5
5.3
20.7
17.5
4.2
3.8
20.6
21.5
1.3
1.1
Bajaj Auto
Neutral
2,901
-
83,937
25,093
27,891
19.5
19.2
143.9
162.5
20.2
17.9
5.7
4.9
30.3
29.4
3.1
2.7
Bharat Forge
Neutral
1,186
-
27,601
7,726
8,713
20.5
21.2
35.3
42.7
33.6
27.8
6.2
5.6
18.9
20.1
3.6
3.2
Ceat
Neutral
1,870
-
7,564
7,524
8,624
13.0
12.7
131.1
144.3
14.3
13.0
2.6
2.2
19.8
18.6
1.1
0.9
Eicher Motors
Neutral
29,326
-
79,830
16,583
20,447
17.5
18.0
598.0
745.2
49.0
39.4
16.8
12.8
41.2
38.3
4.6
3.7
Exide Industries
Neutral
227
-
19,325
7,439
8,307
15.0
15.0
8.1
9.3
28.1
24.5
3.9
3.5
14.3
16.7
2.2
2.0
Gabriel India
Neutral
137
-
1,974
1,544
1,715
9.0
9.3
5.4
6.3
25.4
21.8
4.8
4.3
18.9
19.5
1.2
1.1
Hero Motocorp
Neutral
3,827
-
76,418
28,083
30,096
15.3
15.7
171.8
187.0
22.3
20.5
7.8
6.5
30.1
27.9
2.5
2.3
Indag Rubber
Neutral
207
-
542
286
326
19.8
16.8
11.7
13.3
17.7
15.5
3.0
2.8
17.8
17.1
1.6
1.4
Jamna Auto Industries
Neutral
264
-
2,102
1,486
1,620
9.8
9.9
15.0
17.2
17.6
15.3
3.9
3.3
21.8
21.3
1.5
1.3
JK Tyres
Neutral
176
-
3,989
7,455
8,056
15.0
15.0
21.8
24.5
8.1
7.2
1.7
1.4
22.8
21.3
0.7
0.6
L G Balakrishnan & Bros Neutral
737
-
1,157
1,302
1,432
11.6
11.9
43.7
53.0
16.9
13.9
2.4
2.2
13.8
14.2
1.0
0.9
Mahindra and Mahindra Neutral
1,423
-
88,409
46,534
53,077
11.6
11.7
67.3
78.1
21.2
18.2
3.4
3.0
15.4
15.8
1.9
1.6
Maruti
Neutral
7,127
-
215,280
67,822
83,288
16.0
16.4
253.8
312.4
28.1
22.8
6.5
5.2
23.0
22.9
2.8
2.2
Minda Industries
Neutral
626
-
5,408
2,728
3,042
9.0
9.1
68.2
86.2
9.2
7.3
2.1
1.7
23.8
24.3
2.0
1.8
Motherson Sumi
Neutral
455
-
63,805
45,896
53,687
7.8
8.3
13.0
16.1
34.9
28.2
11.2
9.0
34.7
35.4
1.5
1.2
Rane Brake Lining
Neutral
1,274
-
1,008
511
562
11.3
11.5
28.1
30.9
45.3
41.2
6.9
6.3
15.3
15.0
2.1
1.9
Setco Automotive
Neutral
40
-
538
741
837
13.0
13.0
15.2
17.0
2.7
2.4
0.4
0.4
15.8
16.3
1.1
1.0
Subros
Neutral
261
-
1,565
1,488
1,681
11.7
11.9
6.4
7.2
40.8
36.4
4.3
3.9
10.8
11.4
1.3
1.1
Swaraj Engines
Neutral
1,907
-
2,368
660
810
15.2
16.4
54.5
72.8
35.0
26.2
10.9
9.9
31.5
39.2
3.4
2.8
Tata Motors
Neutral
478
-
138,015
300,209
338,549
8.9
8.4
42.7
54.3
11.2
8.8
1.8
1.5
15.6
17.2
0.6
0.5
TVS Motor
Neutral
542
-
25,757
13,390
15,948
6.9
7.1
12.8
16.5
42.5
32.8
10.6
8.4
26.3
27.2
2.0
1.6
Capital Goods
ACE
Neutral
66
-
656
709
814
4.1
4.6
1.4
2.1
47.4
31.6
2.0
1.8
4.4
6.0
1.1
1.0
BEML
Neutral
1,239
-
5,158
3,451
4,055
6.3
9.2
31.4
57.9
39.5
21.4
2.4
2.2
6.3
10.9
1.6
1.4
BGR Energy
Neutral
161
-
1,159
16,567
33,848
6.0
5.6
7.8
5.9
20.6
27.2
1.2
1.1
4.7
4.2
0.2
0.1
Stock Watch
June 06, 2017
Company Name
Reco
CMP
Target
Mkt Cap
Sales ( Čcr )
OPM(%)
EPS (Č)
PER(x)
P/BV(x)
RoE(%)
EV/Sales(x)
(Č)
Price ( Č)
( Č cr )
FY17E
FY18E
FY17E
FY18E
FY17E
FY18E
FY17E
FY18E
FY17E
FY18E
FY17E
FY18E
FY17E
FY18E
Capital Goods
Bharat Electronics
Neutral
170
-
37,972
8,137
9,169
16.8
17.2
58.7
62.5
2.9
2.7
0.5
0.4
44.6
46.3
3.6
3.3
BHEL
Neutral
140
-
34,205
28,797
34,742
-
2.8
2.3
6.9
60.8
20.3
1.0
1.0
1.3
4.8
0.8
0.6
Blue Star
Buy
643
760
6,143
4,283
5,077
5.9
7.3
14.9
22.1
43.2
29.0
8.4
7.1
20.4
26.4
1.5
1.2
CG Power and Industrial
Neutral
85
-
5,299
5,777
6,120
5.9
7.0
3.3
4.5
25.6
18.8
1.1
1.1
4.4
5.9
0.9
0.7
Solutions
Greaves Cotton
Neutral
160
-
3,901
1,755
1,881
16.8
16.9
7.8
8.5
20.5
18.8
4.1
3.8
20.6
20.9
1.9
1.7
Inox Wind
Neutral
142
-
3,159
5,605
6,267
15.7
16.4
24.8
30.0
5.7
4.8
1.6
1.2
25.9
24.4
0.6
0.5
KEC International
Neutral
266
-
6,844
9,294
10,186
7.9
8.1
9.9
11.9
26.9
22.4
3.9
3.4
15.6
16.3
1.0
0.9
KEI Industries
Accumulate
218
239
1,697
2,682
3,058
10.4
10.0
11.7
12.8
18.6
17.0
3.7
3.1
20.1
18.2
0.8
0.7
Thermax
Neutral
977
-
11,646
5,421
5,940
7.3
7.3
25.7
30.2
38.0
32.4
4.6
4.2
12.2
13.1
2.0
1.9
VATech Wabag
Neutral
678
-
3,701
3,136
3,845
8.9
9.1
26.0
35.9
26.1
18.9
3.3
2.8
13.4
15.9
1.1
0.9
Voltas
Neutral
495
-
16,379
6,511
7,514
7.9
8.7
12.9
16.3
38.4
30.4
6.9
6.1
16.7
18.5
2.3
1.9
Cement
ACC
Neutral
1,645
-
30,884
11,225
13,172
13.2
16.9
44.5
75.5
37.0
21.8
3.5
3.2
11.2
14.2
2.8
2.3
Ambuja Cements
Neutral
240
-
47,655
9,350
10,979
18.2
22.5
5.8
9.5
41.4
25.3
3.5
3.1
10.2
12.5
5.1
4.3
India Cements
Neutral
214
-
6,581
4,364
4,997
18.5
19.2
7.9
11.3
27.1
19.0
2.0
1.9
8.0
8.5
2.3
2.0
J K Lakshmi Cement
Neutral
498
-
5,858
2,913
3,412
14.5
19.5
7.5
22.5
66.4
22.1
4.1
3.4
12.5
18.0
2.6
2.2
JK Cement
Neutral
1,091
-
7,630
4,398
5,173
15.5
17.5
31.2
55.5
35.0
19.7
4.2
3.6
12.0
15.5
2.3
1.9
Orient Cement
Neutral
154
-
3,155
2,114
2,558
18.5
20.5
8.1
11.3
19.0
13.6
2.8
2.4
9.0
14.0
2.1
1.7
UltraTech Cement
Neutral
4,189
-
114,985
25,768
30,385
21.0
23.5
111.0
160.0
37.7
26.2
4.8
4.2
13.5
15.8
4.6
3.8
Construction
Engineers India
Neutral
159
-
10,704
1,725
1,935
16.0
19.1
11.4
13.9
13.9
11.4
1.9
1.9
13.4
15.3
5.1
4.6
Gujarat Pipavav Port
Neutral
147
-
7,126
705
788
52.2
51.7
5.0
5.6
29.5
26.3
2.9
2.6
11.2
11.2
9.8
8.2
ITNL
Neutral
102
-
3,339
8,946
10,017
31.0
31.6
8.1
9.1
12.5
11.2
0.5
0.5
4.2
5.0
3.7
3.4
KNR Constructions
Neutral
211
-
2,966
1,385
1,673
14.7
14.0
41.2
48.5
5.1
4.4
1.0
0.8
14.9
15.2
2.2
1.8
Larsen & Toubro
Neutral
1,805
-
168,423
111,017
124,908
11.0
11.0
61.1
66.7
29.5
27.0
3.6
3.3
13.1
12.9
2.6
2.3
MEP Infra
Neutral
92
-
1,500
1,877
1,943
30.6
29.8
3.0
4.2
30.8
22.0
14.9
10.0
0.6
0.6
2.2
2.0
Nagarjuna Const.
Neutral
87
-
4,845
8,842
9,775
9.1
8.8
5.3
6.4
16.4
13.6
1.3
1.2
8.2
9.1
0.7
0.6
NBCC
Neutral
201
-
18,104
7,428
9,549
7.9
8.6
8.2
11.0
24.5
18.3
1.2
1.0
28.2
28.7
2.2
1.6
PNC Infratech
Neutral
146
-
3,751
2,350
2,904
13.1
13.2
9.0
8.8
16.2
16.6
0.6
0.5
15.9
13.9
1.7
1.4
Power Mech Projects
Neutral
587
-
864
1,801
2,219
12.7
14.6
72.1
113.9
8.1
5.2
1.5
1.3
16.8
11.9
0.5
0.4
Sadbhav Engineering
Neutral
317
-
5,430
3,598
4,140
10.3
10.6
9.0
11.9
35.2
26.6
3.7
3.2
9.9
11.9
1.8
1.5
Stock Watch
June 06, 2017
Company Name
Reco
CMP
Target
Mkt Cap
Sales ( Čcr )
OPM(%)
EPS (Č)
PER(x)
P/BV(x)
RoE(%)
EV/Sales(x)
(Č)
Price ( Č)
( Č cr )
FY17E
FY18E
FY17E
FY18E
FY17E
FY18E
FY17E
FY18E
FY17E
FY18E
FY17E
FY18E
FY17E
FY18E
Construction
Simplex Infra
Neutral
465
-
2,299
6,829
7,954
10.5
10.5
31.4
37.4
14.8
12.4
1.5
1.4
9.9
13.4
0.8
0.6
SIPL
Neutral
109
-
3,823
1,036
1,252
65.5
66.2
(8.4)
(5.6)
4.1
4.6
(22.8)
(15.9)
11.9
9.9
Financials
Axis Bank
Accumulate
513
580
122,965
46,932
53,575
3.5
3.4
32.4
44.6
15.9
11.5
2.0
1.8
13.6
16.5
-
-
Bank of Baroda
Neutral
179
-
41,198
19,980
23,178
1.8
1.8
11.5
17.3
15.6
10.3
1.8
1.5
8.3
10.1
-
-
Can Fin Homes
Neutral
2,776
-
7,390
420
526
3.5
3.5
86.5
107.8
32.1
25.8
6.9
5.7
23.6
24.1
-
-
Canara Bank
Neutral
363
-
21,673
15,225
16,836
1.8
1.8
14.5
28.0
25.0
13.0
1.7
1.4
5.8
8.5
-
-
Cholamandalam Inv. &
Buy
1,046
1,230
16,353
2,012
2,317
6.3
6.3
42.7
53.6
24.5
19.5
3.9
3.3
16.9
18.3
-
-
Fin. Co.
Dewan Housing Finance Buy
431
520
13,498
2,225
2,688
2.9
2.9
29.7
34.6
14.5
12.5
2.3
1.5
16.1
14.8
-
-
Equitas Holdings
Buy
160
235
5,411
939
1,281
11.7
11.5
5.8
8.2
27.6
19.5
2.4
2.1
10.9
11.5
-
-
Federal Bank
Accumulate
114
125
19,674
8,259
8,995
3.0
3.0
4.3
5.6
26.5
20.4
2.2
2.1
8.5
10.1
-
-
HDFC
Neutral
1,606
-
255,245
11,475
13,450
3.4
3.4
45.3
52.5
35.5
30.6
6.8
6.0
20.2
20.5
-
-
HDFC Bank
Neutral
1,636
-
420,194
46,097
55,433
4.5
4.5
58.4
68.0
28.0
24.1
4.9
4.1
18.8
18.6
-
-
ICICI Bank
Neutral
320
-
186,283
42,800
44,686
3.1
3.3
18.0
21.9
17.8
14.6
2.4
2.2
11.1
12.3
-
-
Karur Vysya Bank
Accumulate
127
140
7,675
5,640
6,030
3.3
3.2
8.9
10.0
14.3
12.7
1.5
1.4
11.2
11.4
-
-
Lakshmi Vilas Bank
Neutral
189
-
3,620
3,339
3,799
2.7
2.8
11.0
14.0
17.2
13.5
1.8
1.6
11.2
12.7
-
-
LIC Housing Finance
Neutral
739
-
37,277
3,712
4,293
2.6
2.5
39.0
46.0
18.9
16.1
3.6
3.0
19.9
20.1
-
-
Punjab Natl.Bank
Neutral
153
-
32,622
23,532
23,595
2.3
2.4
6.8
12.6
22.5
12.2
3.5
2.5
3.3
6.5
-
-
RBL Bank
Neutral
544
-
20,446
1,783
2,309
2.6
2.6
12.7
16.4
42.8
33.1
4.7
4.2
12.8
13.3
-
-
Repco Home Finance
Accumulate
779
825
4,870
388
457
4.5
4.2
30.0
38.0
26.0
20.5
4.3
3.6
18.0
19.2
-
-
South Ind.Bank
Neutral
29
-
5,140
6,435
7,578
2.5
2.5
2.7
3.1
10.6
9.2
1.4
1.1
10.1
11.2
-
-
St Bk of India
Neutral
287
-
233,037
88,650
98,335
2.6
2.6
13.5
18.8
21.3
15.3
2.0
1.8
7.0
8.5
-
-
Union Bank
Neutral
160
-
11,030
13,450
14,925
2.3
2.3
25.5
34.5
6.3
4.7
0.9
0.8
7.5
10.2
-
-
Yes Bank
Neutral
1,520
-
69,460
8,978
11,281
3.3
3.4
74.0
90.0
20.5
16.9
3.9
3.3
17.0
17.2
-
-
FMCG
Akzo Nobel India
Neutral
1,788
-
8,575
2,955
3,309
13.3
13.7
57.2
69.3
31.3
25.8
10.2
8.6
32.7
33.3
2.7
2.4
Asian Paints
Neutral
1,162
-
111,464
17,128
18,978
16.8
16.4
19.1
20.7
60.8
56.1
21.2
20.0
34.8
35.5
6.4
5.8
Britannia
Neutral
3,639
-
43,671
9,594
11,011
14.6
14.9
80.3
94.0
45.3
38.7
18.6
14.4
41.2
-
4.4
3.8
Colgate
Neutral
1,021
-
27,760
4,605
5,149
23.4
23.4
23.8
26.9
42.9
37.9
23.7
18.6
64.8
66.8
6.0
5.3
Dabur India
Accumulate
286
304
50,371
8,315
9,405
19.8
20.7
8.1
9.2
35.3
31.1
9.8
8.2
31.6
31.0
5.7
5.0
GlaxoSmith Con*
Neutral
5,406
-
22,737
4,350
4,823
21.2
21.4
179.2
196.5
30.2
27.5
8.0
6.8
27.1
26.8
4.6
4.1
Stock Watch
June 06, 2017
Company Name
Reco
CMP
Target
Mkt Cap
Sales ( Čcr )
OPM(%)
EPS (Č)
PER(x)
P/BV(x)
RoE(%)
EV/Sales(x)
(Č)
Price ( Č)
( Č cr )
FY17E FY18E
FY17E
FY18E
FY17E
FY18E
FY17E
FY18E
FY17E
FY18E
FY17E
FY18E
FY17E
FY18E
FMCG
Godrej Consumer
Neutral
1,815
-
61,814
10,235
11,428
18.4
18.6
41.1
44.2
44.2
41.1
9.8
8.3
24.9
24.8
6.1
5.4
HUL
Neutral
1,098
-
237,570
35,252
38,495
17.8
17.8
20.7
22.4
53.2
49.0
50.8
43.6
95.6
88.9
6.6
6.0
ITC
Neutral
318
-
385,679
40,059
44,439
38.3
39.2
9.0
10.1
35.4
31.3
9.9
8.6
27.8
27.5
9.1
8.2
Marico
Neutral
324
-
41,798
6,430
7,349
18.8
19.5
6.4
7.7
50.6
42.1
15.3
12.9
33.2
32.5
6.3
5.5
Nestle*
Neutral
6,725
-
64,837
10,073
11,807
20.7
21.5
124.8
154.2
53.9
43.6
22.1
19.9
34.8
36.7
6.2
5.3
Procter & Gamble
Neutral
7,736
-
25,113
2,939
3,342
23.2
23.0
146.2
163.7
52.9
47.3
13.4
11.1
25.3
23.5
8.1
7.0
Hygiene
Tata Global
Neutral
155
-
9,779
8,675
9,088
9.8
9.8
7.4
8.2
20.9
18.9
1.7
1.6
7.9
8.1
1.0
1.0
IT
HCL Tech^
Buy
858
1,014
122,457
46,723
52,342
22.1
20.9
60.0
62.8
14.3
13.7
3.6
3.1
25.3
22.4
2.4
2.0
Infosys
Buy
960
1,179
220,553
68,484
73,963
26.0
26.0
63.0
64.0
15.2
15.0
3.2
2.9
20.8
19.7
2.9
2.5
TCS
Neutral
2,601
-
512,518
117,966
127,403
27.5
27.6
134.3
144.5
19.4
18.0
5.8
5.4
29.8
29.7
4.0
3.7
Tech Mahindra
Buy
403
533
39,248
29,141
31,051
14.4
15.0
32.3
35.6
12.5
11.3
2.1
1.9
17.1
17.0
1.2
1.1
Wipro
Neutral
556
-
135,175
55,421
58,536
20.3
20.3
35.1
36.5
15.8
15.2
2.7
2.4
19.2
14.6
1.9
1.6
Media
D B Corp
Neutral
370
-
6,809
2,297
2,590
27.4
28.2
21.0
23.4
17.6
15.8
4.1
3.6
23.7
23.1
2.8
2.4
Hindustan Media
Neutral
281
-
2,059
1,016
1,138
24.3
25.2
27.3
30.1
10.3
9.3
2.0
1.7
16.2
15.8
1.4
1.2
Ventures
HT Media
Neutral
81
-
1,884
2,693
2,991
12.6
12.9
7.9
9.0
10.3
9.0
0.9
0.8
7.8
8.3
0.3
0.2
Jagran Prakashan
Buy
182
225
5,960
2,355
2,635
28.0
28.0
10.8
12.5
16.9
14.6
3.7
3.2
21.7
21.7
2.5
2.2
Sun TV Network
Neutral
840
-
33,091
2,850
3,265
70.1
71.0
26.2
30.4
32.1
27.6
8.2
7.2
24.3
25.6
11.2
9.6
TV Today Network
Buy
268
344
1,598
567
645
26.7
27.0
15.4
18.1
17.4
14.8
2.6
2.3
14.9
15.2
2.4
2.0
Metals & Mining
Coal India
Neutral
264
-
164,062
84,638
94,297
21.4
22.3
24.5
27.1
10.8
9.8
4.5
4.3
42.6
46.0
1.5
1.3
Hind. Zinc
Neutral
234
-
98,978
14,252
18,465
55.9
48.3
15.8
21.5
14.8
10.9
2.4
2.1
17.0
20.7
6.9
5.4
Hindalco
Neutral
197
-
44,194
107,899
112,095
7.4
8.2
9.2
13.0
21.4
15.2
1.0
1.0
4.8
6.6
0.9
0.9
JSW Steel
Neutral
191
-
46,048
53,201
58,779
16.1
16.2
130.6
153.7
1.5
1.2
0.2
0.2
14.0
14.4
1.6
1.4
NMDC
Neutral
113
-
35,625
6,643
7,284
44.4
47.7
7.1
7.7
15.9
14.6
1.4
1.3
8.8
9.2
3.1
2.8
SAIL
Neutral
57
-
23,603
47,528
53,738
(0.7)
2.1
(1.9)
2.6
22.0
0.6
0.6
(1.6)
3.9
1.4
1.2
Tata Steel
Neutral
491
-
47,706
121,374
121,856
7.2
8.4
18.6
34.3
26.4
14.3
1.7
1.5
6.1
10.1
1.0
1.0
Vedanta
Neutral
229
-
85,272
71,744
81,944
19.2
21.7
13.4
20.1
17.1
11.4
1.5
1.3
8.4
11.3
1.6
1.2
Oil & Gas
GAIL
Neutral
398
-
67,297
56,220
65,198
9.3
10.1
27.1
33.3
14.7
12.0
1.3
1.3
9.3
10.7
1.4
1.2
Indian Oil Corp
Neutral
422
-
204,943
373,359
428,656
5.9
5.5
54.0
59.3
7.8
7.1
1.2
1.1
16.0
15.6
0.7
0.6
ONGC
Neutral
176
-
225,223
137,222
152,563
15.0
21.8
19.5
24.1
9.0
7.3
0.8
0.7
8.5
10.1
1.9
1.7
Stock Watch
June 06, 2017
Company Name
Reco
CMP
Target
Mkt Cap
Sales ( Čcr )
OPM(%)
EPS (Č)
PER(x)
P/BV(x)
RoE(%)
EV/Sales(x)
(Č)
Price ( Č)
( Č cr )
FY17E FY18E
FY17E
FY18E
FY17E
FY18E
FY17E
FY18E
FY17E
FY18E
FY17E
FY18E
FY17E
FY18E
Oil & Gas
Reliance Industries
Neutral
1,329
-
432,083
301,963
358,039
12.1
12.6
87.7
101.7
15.2
13.1
1.6
1.4
10.7
11.3
1.9
1.6
Pharmaceuticals
Alembic Pharma
Buy
547
648
10,317
3,101
3,966
19.7
20.5
21.4
25.5
25.6
21.5
5.4
4.4
23.0
22.8
3.3
2.4
Alkem Laboratories Ltd
Accumulate
1,954
2,161
23,358
5,853
6,901
17.1
18.4
74.6
85.0
26.2
23.0
5.5
4.6
21.1
20.2
4.0
3.4
Aurobindo Pharma
Buy
593
823
34,740
14,845
17,086
21.5
22.1
39.4
44.7
15.1
13.3
3.7
2.9
27.6
24.7
2.5
2.1
Aventis*
Neutral
4,041
-
9,306
2,206
2,508
16.6
16.8
128.9
139.9
31.4
28.9
5.4
4.2
21.6
23.5
4.0
3.3
Cadila Healthcare
Neutral
491
-
50,215
9,220
11,584
18.4
20.3
14.5
18.7
33.8
26.2
7.2
5.9
23.5
24.6
5.8
4.4
Cipla
Reduce
534
465
42,955
15,378
18,089
15.7
16.8
19.3
24.5
27.7
21.8
3.2
2.9
12.3
13.9
3.0
2.5
Dishman Pharma
Sell
301
143
4,859
1,718
1,890
22.7
22.8
9.5
11.3
31.7
26.6
3.1
2.8
10.1
10.9
3.3
2.9
Dr Reddy's
Neutral
2,535
-
41,998
14,081
15,937
16.1
18.6
72.6
105.9
34.9
23.9
3.4
3.1
9.6
13.6
3.2
2.8
GSK Pharma*
Neutral
2,469
-
20,916
2,927
3,290
11.8
16.2
34.4
49.6
71.8
49.8
10.4
10.8
13.9
21.3
6.9
6.2
Indoco Remedies
Buy
197
240
1,814
1,112
1,289
16.2
18.2
11.6
16.0
17.0
12.3
2.7
2.3
17.0
20.1
1.8
1.5
Ipca labs
Buy
511
613
6,451
3,258
3,747
12.8
15.3
12.1
19.2
42.3
26.6
2.6
2.4
6.4
9.5
2.1
1.8
Lupin
Buy
1,159
1,809
52,334
15,912
18,644
26.4
26.7
58.1
69.3
19.9
16.7
3.9
3.2
21.4
20.9
3.4
2.7
Natco Pharma
Neutral
966
-
16,836
2,090
2,335
32.1
26.6
26.8
23.2
36.0
41.7
10.2
8.8
28.4
21.1
8.1
99.7
Sun Pharma
Buy
512
847
122,937
31,129
35,258
32.0
32.9
30.2
35.3
17.0
14.5
2.8
2.3
20.0
20.1
3.5
2.9
Power
NTPC
Neutral
163
-
134,030
86,605
95,545
17.5
20.8
11.8
13.4
13.8
12.1
1.4
1.3
10.5
11.1
2.9
2.9
Power Grid
Accumulate
205
223
107,300
25,315
29,193
88.2
88.7
14.2
17.2
14.5
12.0
2.2
1.9
15.2
16.1
8.9
8.0
Tata Power
Neutral
81
-
21,909
36,916
39,557
17.4
27.1
5.1
6.3
15.9
12.9
1.4
1.3
9.0
10.3
1.6
1.4
Real Estate
MLIFE
Buy
424
522
2,178
1,152
1,300
22.7
24.6
29.9
35.8
14.2
11.9
1.1
1.0
7.6
8.6
2.6
2.2
Prestige Estate
Neutral
253
-
9,476
4,707
5,105
25.2
26.0
10.3
13.0
24.5
19.4
2.0
1.8
10.3
10.2
3.2
2.8
Telecom
Bharti Airtel
Neutral
372
-
148,843
105,086
114,808
34.5
34.7
12.2
16.4
30.5
22.7
2.1
1.9
6.8
8.4
2.3
2.0
Idea Cellular
Neutral
82
-
29,405
40,133
43,731
37.2
37.1
6.4
6.5
12.7
12.6
1.1
1.0
8.2
7.6
1.8
1.5
zOthers
Abbott India
Neutral
4,209
-
8,944
3,153
3,583
14.1
14.4
152.2
182.7
27.7
23.0
135.8
116.0
25.6
26.1
2.5
2.2
Asian Granito
Neutral
400
-
1,205
1,060
1,169
12.2
12.5
12.7
15.9
31.6
25.2
3.0
2.7
9.5
10.7
1.4
1.3
Bajaj Electricals
Accumulate
357
395
3,617
4,801
5,351
5.7
6.2
10.4
13.7
34.3
26.1
4.2
3.8
12.4
14.5
0.8
0.7
Banco Products (India)
Neutral
224
-
1,600
1,353
1,471
12.3
12.4
14.5
16.3
15.4
13.7
21.3
19.2
14.5
14.6
1.1
120.7
Coffee Day Enterprises
Neutral
247
-
5,094
2,964
3,260
20.5
21.2
4.7
8.0
-
30.9
2.9
2.6
5.5
8.5
2.1
1.9
Ltd
Competent Automobiles Neutral
202
-
129
1,137
1,256
3.1
2.7
28.0
23.6
7.2
8.6
38.8
35.1
14.3
11.5
0.1
0.1
Elecon Engineering
Neutral
65
-
724
1,482
1,660
13.7
14.5
3.9
5.8
16.6
11.1
3.9
3.6
7.8
10.9
0.8
0.7
Stock Watch
June 06, 2017
Company Name
Reco
CMP
Target
Mkt Cap
Sales ( Čcr )
OPM(%)
EPS (Č)
PER(x)
P/BV(x)
RoE(%)
EV/Sales(x)
(Č)
Price ( Č)
( Č cr )
FY17E
FY18E
FY17E
FY18E
FY17E
FY18E
FY17E
FY18E
FY17E
FY18E
FY17E
FY18E
FY17E
FY18E
zOthers
Finolex Cables
Neutral
506
-
7,733
2,883
3,115
12.0
12.1
14.2
18.6
35.6
27.2
18.9
16.6
15.8
14.6
2.4
2.2
Garware Wall Ropes
Neutral
819
-
1,793
863
928
15.1
15.2
36.4
39.4
22.5
20.8
4.1
3.5
17.5
15.9
2.0
1.8
Goodyear India*
Neutral
851
-
1,963
1,598
1,704
10.4
10.2
49.4
52.6
17.2
16.2
79.5
69.8
18.2
17.0
0.9
129.8
Hitachi
Neutral
2,131
-
5,795
2,081
2,433
8.8
8.9
33.4
39.9
63.8
53.4
51.5
42.9
22.1
21.4
2.8
2.3
HSIL
Neutral
342
-
2,475
2,384
2,515
15.8
16.3
15.3
19.4
22.4
17.7
22.2
19.1
7.8
9.3
1.2
1.1
Interglobe Aviation
Neutral
1,135
-
41,023
21,122
26,005
14.5
27.6
110.7
132.1
10.3
8.6
61.4
43.8
168.5
201.1
1.9
1.5
Jyothy Laboratories
Neutral
368
-
6,686
1,440
2,052
11.5
13.0
8.5
10.0
43.3
36.8
10.5
9.7
18.6
19.3
4.9
3.4
Kirloskar Engines India
Neutral
388
-
5,604
2,554
2,800
9.9
10.0
10.5
12.1
36.9
32.0
15.4
14.6
10.7
11.7
1.8
1.6
Ltd
Linc Pen & Plastics
Neutral
269
-
398
382
420
9.3
9.5
13.5
15.7
20.0
17.1
3.4
3.0
17.1
17.3
1.1
1.0
M M Forgings
Neutral
609
-
736
546
608
20.4
20.7
41.3
48.7
14.8
12.5
83.5
73.9
16.6
17.0
1.2
1.1
Manpasand Bever.
Neutral
799
-
4,572
836
1,087
19.6
19.4
16.9
23.8
47.3
33.6
5.7
5.0
12.0
14.8
5.2
3.9
Mirza International
Neutral
143
-
1,717
963
1,069
17.2
18.0
6.1
7.5
23.3
19.0
3.6
3.0
15.0
15.7
2.0
1.8
MT Educare
Neutral
65
-
260
366
417
17.7
18.2
9.4
10.8
7.0
6.1
1.6
1.4
22.2
22.3
0.6
0.5
Narayana Hrudaya
Neutral
335
-
6,851
1,873
2,166
11.5
11.7
2.6
4.0
126.8
84.6
7.8
7.0
6.1
8.3
3.8
3.2
Navkar Corporation
Buy
217
265
3,091
369
561
42.9
42.3
6.9
11.5
31.4
18.8
2.2
2.0
7.4
10.5
9.4
6.2
Navneet Education
Neutral
185
-
4,323
1,062
1,147
24.0
24.0
6.1
6.6
30.4
27.9
6.2
5.5
20.6
19.8
4.2
3.8
Nilkamal
Neutral
2,085
-
3,112
1,995
2,165
10.7
10.4
69.8
80.6
29.9
25.9
119.2
103.5
16.6
16.5
1.6
1.4
Page Industries
Neutral
14,485
-
16,157
2,450
3,124
20.1
17.6
299.0
310.0
48.5
46.7
322.6
246.3
47.1
87.5
6.6
5.2
Parag Milk Foods
Neutral
238
-
2,001
1,919
2,231
9.3
9.6
9.5
12.9
25.2
18.4
3.9
3.2
15.5
17.5
1.2
1.0
Quick Heal
Neutral
216
-
1,516
408
495
27.3
27.0
7.7
8.8
27.9
24.6
2.6
2.6
9.3
10.6
2.9
2.4
Radico Khaitan
Buy
124
147
1,649
1,667
1,824
13.0
13.2
6.7
8.2
18.6
15.1
1.7
1.5
9.0
10.2
1.4
1.2
Relaxo Footwears
Neutral
491
-
5,902
2,085
2,469
9.2
8.2
7.6
8.0
65.0
61.8
25.2
21.5
17.9
18.8
2.9
2.5
S H Kelkar & Co.
Neutral
281
-
4,062
1,036
1,160
15.1
15.0
6.1
7.2
46.0
39.1
4.9
4.5
10.7
11.5
3.8
3.3
Siyaram Silk Mills
Neutral
2,117
-
1,984
1,652
1,857
11.6
11.7
92.4
110.1
22.9
19.2
3.4
2.9
14.7
15.2
1.4
1.3
Styrolution ABS India*
Neutral
777
-
1,366
1,440
1,537
9.2
9.0
40.6
42.6
19.1
18.2
48.9
44.4
12.3
11.6
0.9
0.8
Surya Roshni
Neutral
289
-
1,265
3,342
3,625
7.8
7.5
17.3
19.8
16.7
14.6
31.7
25.5
10.5
10.8
0.6
0.6
Team Lease Serv.
Neutral
1,200
-
2,052
3,229
4,001
1.5
1.8
22.8
32.8
52.7
36.5
5.7
4.9
10.7
13.4
0.5
0.4
The Byke Hospitality
Neutral
190
-
760
287
384
20.5
20.5
7.6
10.7
24.9
17.7
5.2
4.2
20.7
23.5
2.7
2.0
Transport Corporation of
Neutral
329
-
2,516
2,671
2,911
8.5
8.8
13.9
15.7
23.7
21.0
3.2
2.9
13.7
13.8
1.0
1.0
India
Stock Watch
June 06, 2017
Company Name
Reco
CMP
Target Mkt Cap
Sales ( Čcr )
OPM(%)
EPS (Č)
PER(x)
P/BV(x)
RoE(%)
EV/Sales(x)
(Č)
Price ( Č)
( Č cr )
FY17E FY18E FY17E FY18E FY17E FY18E FY17E FY18E FY17E FY18E FY17E FY18E FY17E FY18E
zOthers
TVS Srichakra
Neutral
4,050
-
3,101
2,304
2,614
13.7
13.8
231.1
266.6
17.5
15.2
455.0
358.3
33.9
29.3
1.3
1.2
UFO Moviez
Neutral
378
-
1,044
619
685
33.2
33.4
30.0
34.9
12.6
10.9
1.8
1.5
13.8
13.9
1.4
1.1
Visaka Industries
Neutral
416
-
660
1,051
1,138
10.3
10.4
21.0
23.1
19.8
18.0
53.3
49.9
9.0
9.2
0.9
0.8
VRL Logistics
Neutral
327
-
2,987
1,902
2,119
16.7
16.6
14.6
16.8
22.5
19.5
4.9
4.3
21.9
22.2
1.7
1.5
Wonderla Holidays
Neutral
371
-
2,096
287
355
38.0
40.0
11.3
14.2
32.8
26.1
4.7
4.1
21.4
23.9
7.0
5.7
VIP Industries
Accumulate
199
218
2,808
1,270
1,450
10.4
10.4
5.6
6.5
35.5
30.6
7.4
6.4
20.7
21.1
2.2
1.9
Navin Fluorine
Buy
3,063
3,650
2,999
789
945
21.1
22.4
120.1
143.4
25.5
21.4
4.1
3.5
17.8
18.5
3.7
3.0
Source: Company, Angel Research; Note: *December year end; #September year end; &October year end; Price as on June 05, 2017
Market Outlook
June 06, 2017
Research Team Tel: 022 - 39357800
DISCLAIMER
Angel Broking Private Limited (hereinafter referred to as “Angel”) is a registered Member of National Stock Exchange of India
Limited,Bombay Stock Exchange Limited and Metropolitan Stock Exchange Limited. It is also registered as a Depository Participant with
CDSL and Portfolio Manager with SEBI. It also has registration with AMFI as a Mutual Fund Distributor. Angel Broking Private Limited is a
registered entity with SEBI for Research Analyst in terms of SEBI (Research Analyst) Regulations, 2014 vide registration number
INH000000164. Angel or its associates has not been debarred/ suspended by SEBI or any other regulatory authority for accessing
/dealing in securities Market. Angel or its associates/analyst has not received any compensation / managed or
co-managed public offering of securities of the company covered by Analyst during the past twelve months.
This document is solely for the personal information of the recipient, and must not be singularly used as the basis of any investment
decision. Nothing in this document should be construed as investment or financial advice. Each recipient of this document should make
such investigations as they deem necessary to arrive at an independent evaluation of an investment in the securities of the companies
referred to in this document (including the merits and risks involved), and should consult their own advisors to determine the merits and
risks of such an investment.
Reports based on technical and derivative analysis center on studying charts of a stock's price movement, outstanding positions and
trading volume, as opposed to focusing on a company's fundamentals and, as such, may not match with a report on a company's
fundamentals. Investors are advised to refer the Fundamental and Technical Research Reports available on our website to evaluate the
contrary view, if any.
The information in this document has been printed on the basis of publicly available information, internal data and other reliable
sources believed to be true, but we do not represent that it is accurate or complete and it should not be relied on as such, as this
document is for general guidance only. Angel Broking Pvt. Limited or any of its affiliates/ group companies shall not be in any way
responsible for any loss or damage that may arise to any person from any inadvertent error in the information contained in this report.
Angel Broking Pvt. Limited has not independently verified all the information contained within this document. Accordingly, we cannot
testify, nor make any representation or warranty, express or implied, to the accuracy, contents or data contained within this document.
While Angel Broking Pvt. Limited endeavors to update on a reasonable basis the information discussed in this material, there may be
regulatory, compliance, or other reasons that prevent us from doing so.
This document is being supplied to you solely for your information, and its contents, information or data may not be reproduced,
redistributed or passed on, directly or indirectly.
Neither Angel Broking Pvt. Limited, nor its directors, employees or affiliates shall be liable for any loss or damage that may arise from
or in connection with the use of this information.